Marine Survey Technology
Applications of Sub-Bottom Profilers: Revealing What Lies Beneath the Seafloor
Side-scan sonar tells us what sits on the seafloor. But most of the engineering decisions that actually matter—how deep a pipeline needs to be buried, whether hazardous shallow gas is present, how thick the soft sediment is before reaching bedrock—can only be answered by looking beneath that surface. That is where the sub-bottom profiler (SBP) takes over: an instrument that turns acoustic returns into cross-sectional slices of seafloor stratigraphy, layer by layer.
How Sub-Bottom Profilers Work
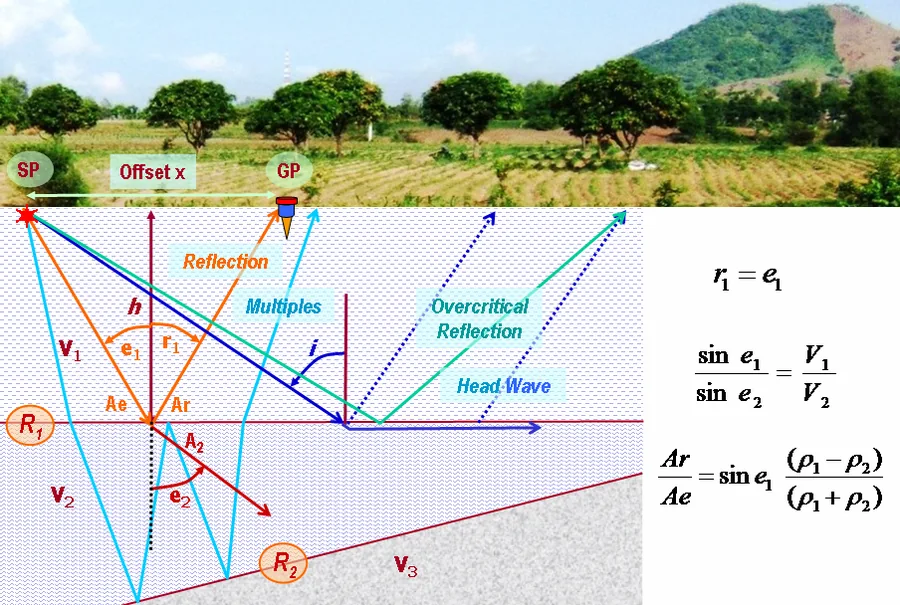
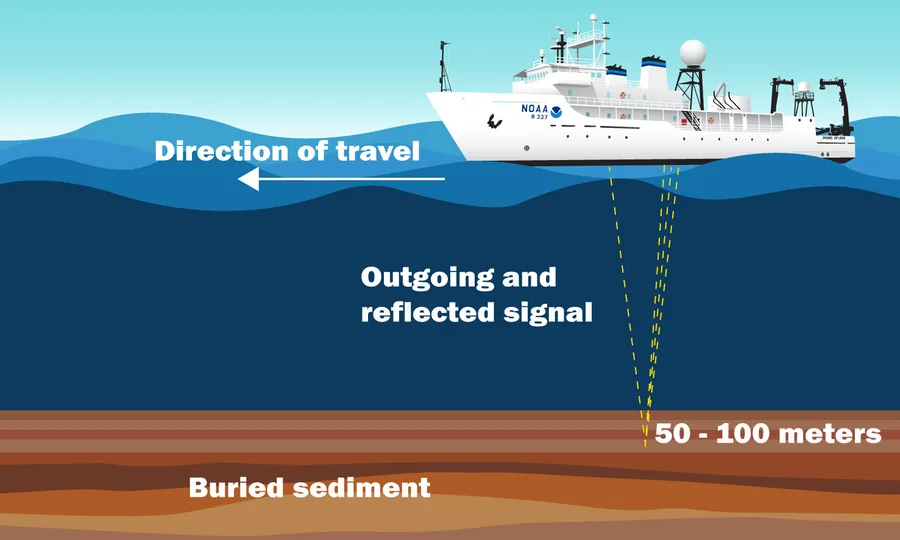
The instrument emits a low-to-mid frequency acoustic signal vertically toward the seafloor through a transducer. The sound pulse travels through the water column before striking the seabed—part of the acoustic energy reflects back toward the surface, while the rest penetrates the upper layers of substrate. The returning pulse is picked up either by the same transducer (in chirp/pinger systems) or by a separately towed hydrophone (in boomer systems), then digitized and processed into a visual representation of the subsurface geological boundaries.
The underlying principle is simple yet consistent: the lower the frequency used, the deeper it penetrates into the sediment—but at the cost of coarser image resolution. Conversely, higher frequencies deliver sharp detail in shallow layers but attenuate quickly before reaching significant depth. Penetration depth is also strongly influenced by sediment density; fine-grained material (such as mud or fine sand) transmits the signal far deeper than coarse-grained material (such as gravel).
Four System Types, Four Different Personalities
No single sub-bottom profiler suits every need—system selection always comes down to a trade-off between resolution and the penetration depth a survey requires:
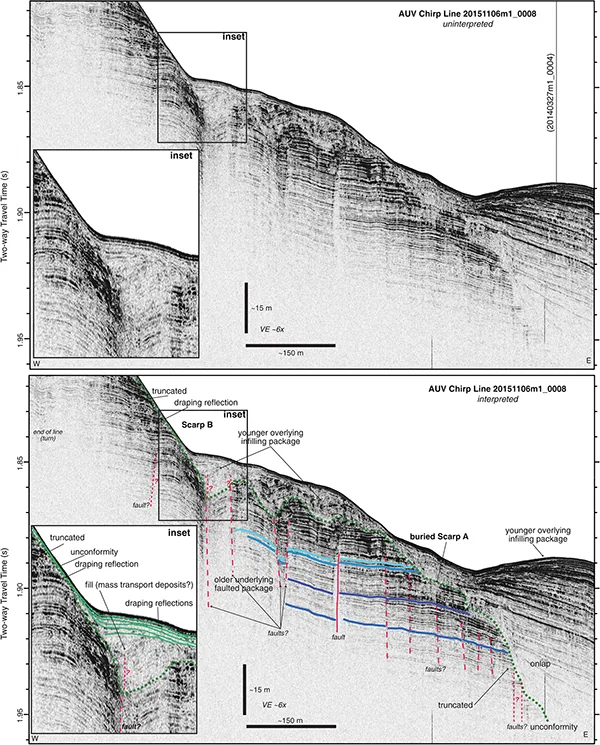
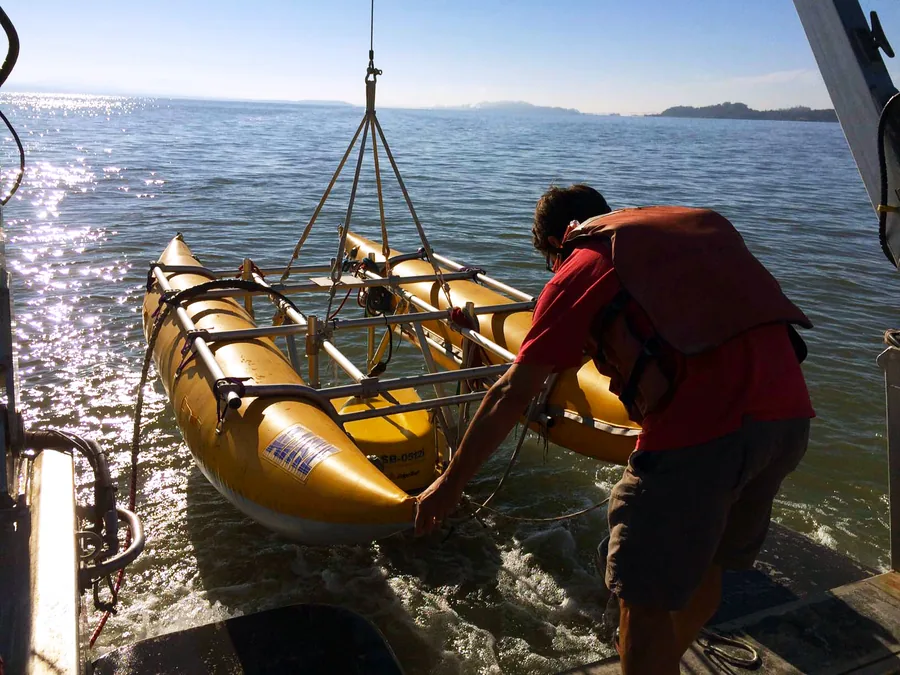
- Chirp — emits a swept-frequency pulse, typically 2–18 kHz. Produces very high-resolution imaging of the uppermost few meters of subsurface but does not penetrate as deeply as boomer or sparker systems.
- Pinger — operates at higher frequencies (2–20 kHz), generally used to detect geological horizons at shallow-to-mid strata depths.
- Boomer — a lower-frequency system (dominant frequencies 500 Hz–5 kHz) that uses an induction coil and metal plate to generate acoustic pulses with an energy source of 50–300 joules. Capable of penetrating up to 50 m in fine-grained sediment and around 25 m in coarse-grained sediment.
- Sparker — works by producing an electrical spark that vaporizes seawater around the tip of the array, generating a pressure wave. High-powered sparker systems (up to ~12,000 kJ) can reach frequencies as low as 50 Hz and penetrate down to 1,000 m—far beyond the capability of the other three systems.
A Historical Thread: From the First Seismic Experiment to Modern Chirp
The foundations of this technology predate the term "sub-bottom profiler" itself. Captain Nicholas Heck developed radio acoustic ranging (RAR) in 1923–1924, an early step toward modern electronic navigation systems and oceanic seismic refraction and reflection profiling. But the true landmark moment in marine geophysics came in 1935, when Dr. Maurice Ewing—later dubbed the "father of marine geophysics"—conducted the world's first offshore seismic reflection experiment aboard the Coast and Geodetic Survey ship Oceanographer. From that reflection-based experiment, the modern generation of sub-bottom profilers—chirp, boomer, sparker—was derived and refined over the following decades.
Core Applications in the Field
Pipeline and cable route planning and burial depth assessment
Sub-bottom profilers are a critical tool for assessing sub-seafloor geology and sediment thickness to guide drilling and installation paths for oil and gas exploration and pipeline route planning. SBP data enables three-dimensional analysis of sediment architecture, detecting highly reflective buried objects such as cables, pipelines, and boulders—with penetration depths reaching 35–50 m below the seabed depending on sediment composition and the profiler type used.
Shallow gas and pockmark detection
The presence of gas within sediment causes a sharp decrease in acoustic velocity, producing a "blanking" effect on seismic profiles—a signature that experienced interpreters recognize immediately. Studies in volcanic environments have even shown clear correlation between degassing locations and seafloor or lakebed morphology such as pockmarks and faults, providing insight into how these morphologies influence the degassing process itself.
UXO surveys and geotechnical investigation
Offshore UXO (unexploded ordnance) surveys typically combine magnetometers, gradiometers, sub-bottom profilers, and side-scan sonar to scan for anomalies at and below the seafloor—a combination that is necessary because the SBP is the only instrument in that lineup capable of detecting objects that are already buried, rather than only those exposed at the surface. In geotechnical investigation, sub-bottom profiling has proven to be an excellent tool for identifying pipelines, cables, trenches, depth to bedrock, and small buried hazards—capable of accurately modeling the stratigraphic profile up to 35 m below the seabed, depending on site conditions.
Offshore wind farm site investigation
A North Sea case study showed that processing sub-bottom profiler data beyond conventional practice reduced seabed reverberation and produced clearer geological boundaries—critical for safe cable and anchor installation. The study concluded that while advanced processing requires additional time and cost, the benefits in reduced project uncertainty and enhanced data interpretability outweigh those costs, making it a valuable practice in offshore wind farm development.
Standards and Resolution Specifications
For chirp surveys, common specifications require the system to achieve a vertical bed separation resolution of at least 0.3 m—the threshold that determines whether two closely spaced thin layers can be distinguished or simply blur together in the image. All submitted data is expected to include comprehensive metadata compatible with IHO survey standards, while guidance such as the BOEM G&G Guidelines governs the provision of geophysical, geotechnical, and geohazard data for oil, gas, and offshore energy sectors in the United States. Reconnaissance geotechnical investigations are typically scoped to investigate key geological strata already mapped by the geophysical survey, while ensuring sufficient data density to profile the broad variability of site conditions.
Conclusion
If side-scan sonar answers the question "what is on the seafloor," the sub-bottom profiler answers the far harder one: "what is hidden beneath it." From Maurice Ewing's first seismic reflection experiment in 1935 to the high-resolution chirp systems used in offshore wind farm site investigations today, this technology remains the only practical way to validate assumptions about the subsurface before time and money are committed to an installation placed in the wrong spot.
References
- NOAA Ocean Exploration — Sub-Bottom Profiler
- Unique Group — Understanding Sub-Bottom Profilers and Their Applications
- Applied Acoustics — Guide to Sub-Bottom Profiling; Aspect Surveys — Sub Bottom Profiling
- Exail — Operational Efficiency for the Offshore Wind Industry; EarthDoc — INTOG the Unknown: North Sea Case Study
- Defense Advancement — Sub-Bottom Profilers for Military and UXO Detection; iXblue/Exail — Sub Bottom Profilers
- NOAA Ocean Exploration — History Timeline: The Age of Electronics (1923–1945)
- USGS — Example of Chirp Data; Chirp Sub-Bottom Profiler Deployment
- Bureau of Ocean Energy Management (BOEM) — Guidelines for Providing Geophysical, Geotechnical, and Geohazard Information